The Land That Speaks in Numbers: When Terrain Becomes Readable Text

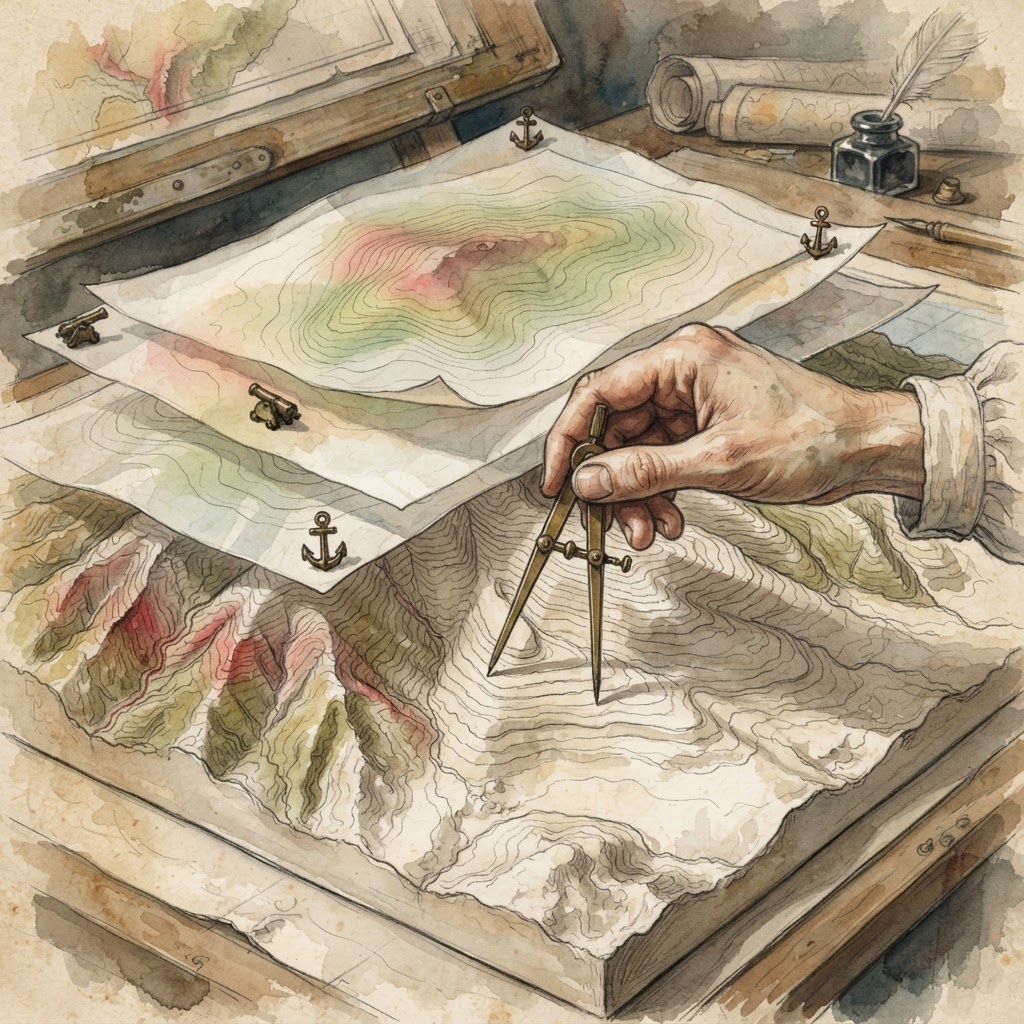
Every building stands on a piece of land with a story — a story of slope and curvature, of elevation and depression. In geomorphometry, these stories are quantified through Landform Parameters that help us interpret complex terrains. But this story was not fully readable until the science of geomorphometry — the quantitative analysis of land surfaces — transformed terrain from descriptive words into numbers and equations amenable to analysis. This transformation is not merely academic; it changes the way architects understand sites and make design decisions. Land is no longer merely a surface we build on; it is an engineering text we read and understand before we design.
From Words to Numbers: How Do We Describe Land?
Before Digital Elevation Models (DEMs), terrain description relied on words: “undulating hill,” “deep valley,” “mountain foot.” These words carry meaning, but they are subjective and not comparable. Geomorphometry offers an alternative language — the language of numbers. Every point on the land surface is described by a set of measurable properties: Slope, Aspect, Profile Curvature, Plan Curvature, Upslope Drainage Area, and Surface Roughness. These properties are not mathematical luxuries; they are the variables that control water flow, erosion, landslides, and vegetation patterns.
The classical method for computing these properties relies on a 3×3 window of elevation values surrounding each point. Using these nine numbers, a mathematical surface is fitted (a partial quartic equation) and its derivatives are calculated — just as we compute a car’s speed from its position over time, but now in two spatial dimensions. This method, established by Zevenbergen and Thorne in 1987, became the cornerstone of the field. Today, with available computing power, these properties can be computed for every point in an entire landscape in seconds.
Slope: The First Variable That Decides Everything
Slope angle is the most widely used topographic measurement because it controls everything: water runoff speed, soil erodibility, the amount of sunlight a surface receives, and even the feasibility of building on a particular plot. In architectural design, slope is not just a number on a map; it is a design decision. Buildings on steep slopes require special foundations, higher excavation costs, and different structural solutions. Buildings on flat land may face drainage problems. Understanding the slope of land is the first step in understanding a site.
Aspect — the direction a slope faces — is equally important. A south-facing slope in the northern hemisphere receives more sunlight than a north-facing one. This is not a minor detail; it is a difference in soil temperature, moisture patterns, and potential vegetation. In passive building design, aspect determines where we place the building and how we orient its openings. The land speaks, and the architect who understands its language designs buildings that work with the site, not against it.
Curvature: When the Curve Matters More Than the Line
Curvature is where geomorphometry becomes truly exciting. Profile Curvature measures how slope changes when moving in the direction of flow — whether the slope is convex (water accelerates) or concave (water slows and sediment deposits). Plan Curvature measures whether a slope directs water inward (channel) or outward (spur). These distinctions are not theoretical; they determine where water collects, where sediment accumulates, and where landslides occur.
In architectural and urban design, understanding curvature allows precise identification of hazard zones. Convex areas on a slope are zones of water acceleration and erosion — not good places to build. Concave areas are deposition zones — they may be suitable for construction but require special drainage solutions. This specialized knowledge transforms planning decisions from guesswork into precise analysis.
From Raw Numbers to Meaningful Forms: Fuzzy Classification
Raw numbers like “slope = 12 degrees” are useful, but engineers often want to group them into understandable landform types — peaks, valleys, slopes, plains. Here comes Fuzzy Classification — a mathematical technique that allows a point to partially belong to multiple classes. A spot on a hillside might be 70% “backslope” and 30% “shoulder.” This reflects the reality that terrain changes gradually rather than in sharp steps.
The most recent approach goes beyond classifying individual pixels to identifying whole objects — contiguous areas that share similar terrain properties. This “object-based” approach produces cleaner, more realistic terrain maps that respect natural discontinuities in the landscape. The result is a map that does not say “this point has a slope of 12 degrees” but says “this is a convex backslope belonging to a particular drainage system.” This is the difference between data and knowledge.
Roughness: When Details Tell Us About the Whole
Surface roughness measures how “bumpy” the land is — the vertical deviations of the real surface from a smooth, ideal version. A flat agricultural field has low roughness; a boulder-strewn mountainside has high roughness. Modern methods use multiscale analysis — looking at terrain at many different zoom levels — to compute roughness in a way that distinguishes between shallow valleys and deep gorges. This is particularly important in site design: high roughness means higher excavation costs and different structural solutions.
But roughness is not merely a construction cost; it is also an environmental indicator. Rough surfaces provide more diverse habitats, slow water runoff, and reduce erosion. In sustainable design, understanding land roughness helps preserve or enhance the environmental characteristics of a site. Land is not a neutral canvas we shape as we wish; it is a living entity with its own properties that must be respected.
When Land Becomes Architectural Text
Ultimately, the parametric description of landforms is not merely an analytical tool; it is a new architectural language. When the architect understands that every point on the land has “coordinates of shape” — slope, curvature, roughness, position in a drainage system — they begin to read the site as they read an architectural text. This text says where we can build and where we cannot, where water collects and where it flows, where the land is stable and where it is prone to collapse. This information is not analytical luxury; it is the foundation of good design.
The upcoming challenge is to integrate this language into everyday design practice. With the increasing availability of high-resolution Digital Elevation Models from satellites and drones, the data is accessible. But data without understanding is just numbers. What is needed is a new generation of architects who read the land as they read blueprints — a generation that sees geometry in numbers and architecture in curves. This is the future that geomorphometry promises: a land speaks in a language that those who design upon it can understand.
✦ ArchUp Editorial Insight
What the reviewed studies reveal is that the parametric description of landforms is not merely an analytical technique but a paradigm shift in how we think about site. The transition from qualitative description (“undulating hill”) to quantitative description (“slope 12 degrees, convex profile curvature, high roughness”) changes the architect’s relationship with the site. Land becomes a readable and analyzable text rather than a passive surface. This shift has profound implications for architectural and urban design.
What is most striking is that this digital language of land reveals relationships that were not visible before. The discovery that convex profile curvature accelerates water and increases erosion, while concave curvature slows water and deposits sediment — these are causal relationships that can be exploited in design. Instead of treating drainage problems after they occur, they can be avoided by design that responds to the actual shape of the land. The land tells us its problems before they happen.
The broader implications reach the concept of “sustainability” itself. When we build on land without understanding its shape, we create maintenance problems and ongoing costs. When we build with understanding of its shape, we create buildings that work with the site rather than against it. Parametric description provides the tools that make this understanding possible and applicable. This is not technical luxury but the foundation of responsible design.
The final question remains: can parametric land description become a common language among architects and urban planners? When everyone speaks the language of slope, curvature, and roughness, dialogue about a site becomes more precise and realistic. Perhaps this is the deepest lesson from studying geomorphometry: that land is not merely a surface we build on, but an architectural text we read before we design — a text that tells us where to build, how to build, and what to avoid. Reading this text is the difference between design that works with the site and design that works against it.
References:
- Pike, R.J. “Geomorphometry — diversity in quantitative surface analysis.” Progress in Physical Geography: Earth and Environment, 2000.
- King, R.B. “A parametric approach to land system classification.” Geoderma, 1970.
- Zevenbergen, L.W. and Thorne, C.R. “Quantitative analysis of land surface topography.” Earth Surface Processes and Landforms, 1987.
- Hani, A.F.M. and Sathyamoorthy, D. and Sagayan Asirvadam, V. “A method for computation of surface roughness of digital elevation model terrains via multiscale analysis.” Computers & Geosciences, 2011.
- Schmidt, J. and Hewitt, A. “Fuzzy land element classification from DTMs based on geometry and terrain position.” Geoderma, 2004.
- Drăguţ, L. and Eisank, C. “Object representations at multiple scales from digital elevation models.” Geomorphology, 2011.
- Gerçek, D. and Toprak, V. and Strobl, J. “Object-based classification of landforms based on their local geometry and geomorphometric context.” International Journal of Geographical Information Science, 2011.
- Bosch, W. “A Procedure for Quantifying Certain Geomorphological Features.” Geographical Analysis, 1978.
- Giles, P.T. and Franklin, S.E. “An automated approach to the classification of the slope units using digital data.” Geomorphology, 1998.
- Zhou, Q. and Zhu, A.X. “The recent advancement in digital terrain analysis and modeling.” International Journal of Geographical Information Science, 2013.