The Sidewalk Is on the Map. Can You Actually Get Through?

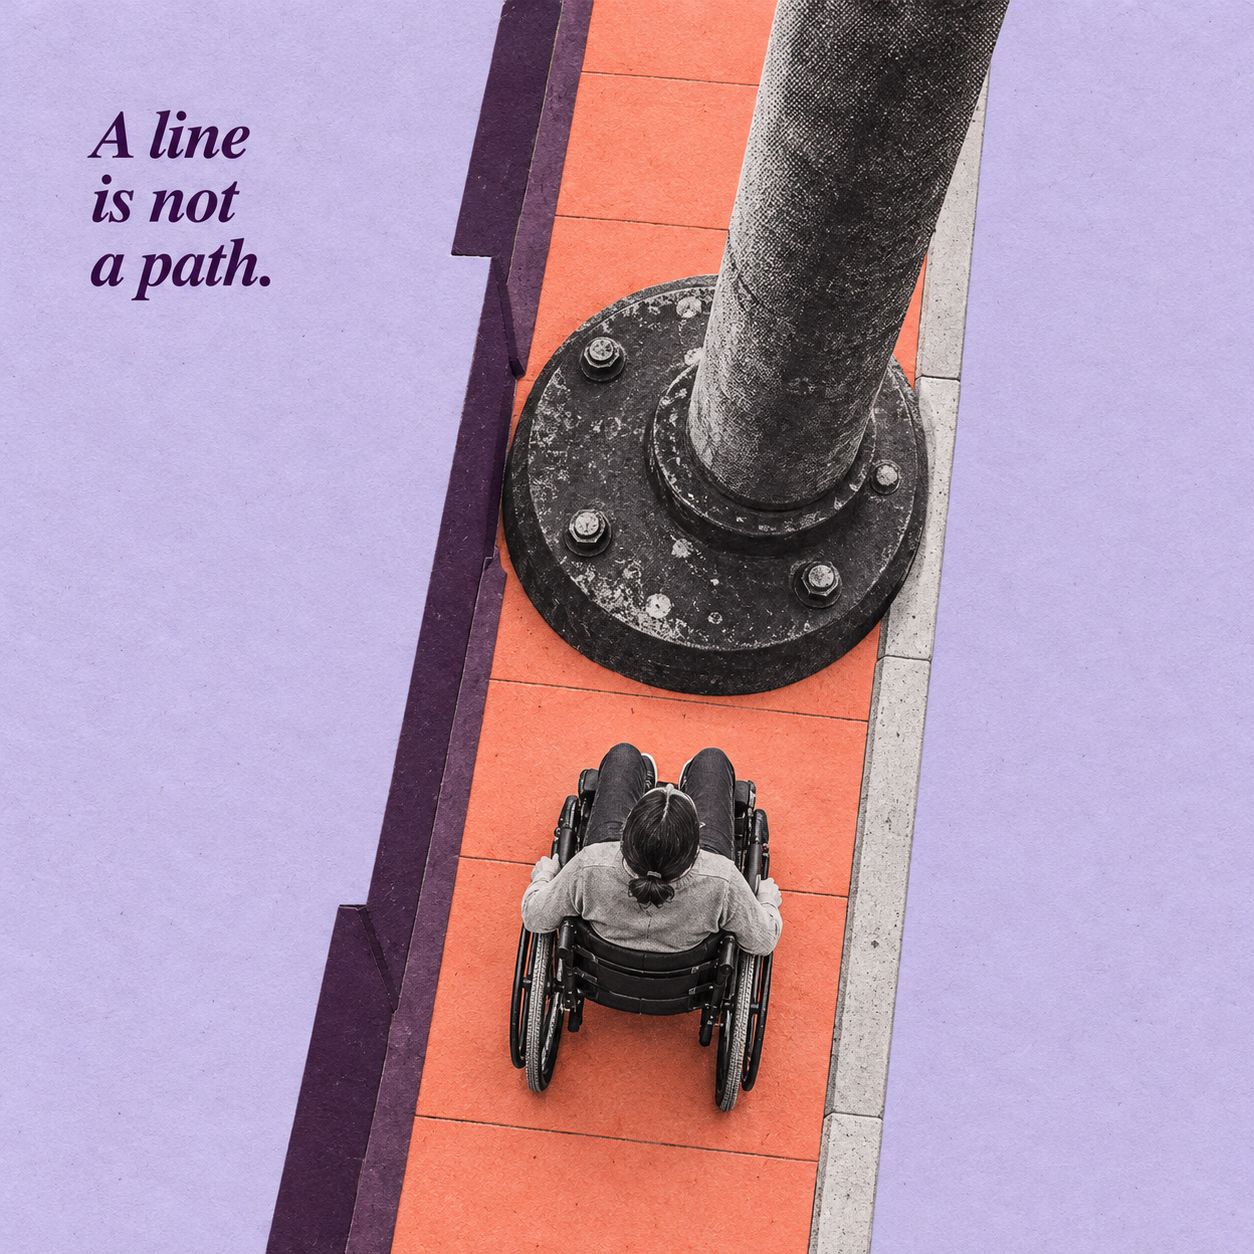
A sidewalk can exist in a municipal inventory and still fail the person trying to use it. A lamp post, a tree pit and a café table may each occupy an apparently modest area; together, their placement can interrupt the only continuous passage. The design question is therefore not simply how much sidewalk a city has, but how much of it remains usable along a complete journey.
Research on clear width, accessibility audits and street imagery reveals a gap between mapping an asset and understanding its performance. Six studies help distinguish what can be measured remotely, what requires closer inspection and what municipalities must manage after construction.
The width that disappears when objects enter the map
Coppola and Marshall examined sidewalk surfaces across Cambridge, Massachusetts, using GIS methods that calculated minimum widths with and without static obstructions. Accounting for objects reduced the reported average clear width from approximately 1.4 to 1.1 metres. The share of segments meeting the study’s three-foot comparison threshold fell from 78% to 51%. [1]
These are findings from one city, using the thresholds examined in the 2021 paper. They are not a universal estimate of lost pedestrian space or a statement of current requirements everywhere. Their significance is methodological: a dataset can substantially overstate usable provision when it treats the paved surface as an unobstructed route.
Walkability and passability answer different questions
Aghaabbasi and colleagues reviewed walkability audit tools and found that path conditions received stronger coverage than disability-related issues, safety and attractiveness in many of the tools examined. Their recommendation was to give greater attention to accessibility and small-scale design factors. [2]
A useful distinction follows. An area can offer nearby destinations and an attractive street environment while a particular journey remains impossible for a wheelchair user. An average neighbourhood score cannot identify every narrow passage, missing connection or difficult manoeuvre. Likewise, clear width alone cannot capture slopes, surface defects, crossing conditions or orientation needs.
Prescott and colleagues’ scoping review treats mobility as more than exposure to individual barriers. It identifies a need to understand navigation from planning a trip to making decisions along the route, alongside broader representation of disabilities and evaluation of interventions. [5] The relevant unit for design is consequently both the local obstacle and the journey it can interrupt.
Street imagery helps, but a photograph has a date
Project Sidewalk demonstrated that remote contributors could label accessibility features and problems in street-view imagery. Its 18-month Washington, DC deployment involved 797 contributors and produced 205,385 labels. This was evidence of scalable data collection, not a count of independently verified defects or completed repairs. [3]
Weld and colleagues subsequently investigated deep learning for detecting sidewalk accessibility problems from streetscape imagery, including the effects of training data and cross-city generalisation. [4] It would therefore be inaccurate to claim that image-based approaches ignore obstacles altogether. The more useful question is which obstacles they recognise, with what reliability, and under what image conditions.
A delivery trolley that appears at lunchtime cannot be fully represented by a panorama captured months earlier. That practical limitation suggests combining a baseline inventory with dated observations of changing conditions. A clear photograph also does not establish the effort needed to pass an object, or guarantee that the next street segment remains accessible.
From mapping barriers to assigning responsibility
Eisenberg and colleagues evaluated 401 local government entities in the United States and found readily available accessibility transition plans in only 54, approximately 13%. [6] Availability of a plan is not proof of implementation; absence from the study’s available records is not proof that no local action occurred. The finding nevertheless directs attention from the sophistication of the map to the organisation responsible for acting on it.
For a street renewal project, the following register is an architectural and operational proposal drawn from the literature, rather than a validated scoring system:
| Record | What it resolves |
|---|---|
| Narrowest continuous clear passage | Whether objects leave a traversable route, rather than an adequate average width. |
| Obstacle type and permanence | Whether the response belongs to design, maintenance, loading management or commercial occupation. |
| Observation date and time | Whether a reported condition is persistent, intermittent or potentially outdated. |
| Journey and users affected | Whether a local obstruction disconnects a stop, crossing, entrance or essential destination. |
| Responsible party and reinspection | Who must act and how restored access will be checked. |
✦ ArchUp Editorial Insight
The conflict is not between attractive streets and accessible streets. It is between allocating each object separately and designing the route as a shared, continuous space. Trees, seating, signs and commercial activity all require a spatial budget. If that budget is settled only after paving is complete, pedestrians inherit the remainder.
ArchUp proposes making continuity of usable passage a project deliverable alongside the inventory of installed assets. The drawing should show how people pass through the arrangement; the operating plan should explain how that passage remains available. This extends the concern with small urban interfaces explored in The Door Is the Smallest Urban Plan.
A city should be able to distinguish a sidewalk it has built, a route it has inspected and a journey its residents can actually complete.
References
- Coppola, N. A., & Marshall, W. E. (2021). Sidewalk Static Obstructions and Their Impact on Clear Width. Transportation Research Record, 2675(6), 200–212. DOI: 10.1177/0361198121991833.
- Aghaabbasi, M., Moeinaddini, M., Shah, M. Z., Asadi-Shekari, Z., & Arjomand Kermani, M. (2018). Evaluating the capability of walkability audit tools for assessing sidewalks. Sustainable Cities and Society, 37, 475–484. DOI: 10.1016/j.scs.2017.12.001.
- Saha, M., et al. (2019). Project Sidewalk: A Web-based Crowdsourcing Tool for Collecting Sidewalk Accessibility Data at Scale. Proceedings of CHI 2019, Paper 62, 1–14. DOI: 10.1145/3290605.3300292.
- Weld, G., Jang, E., Li, A., Zeng, A., Heimerl, K., & Froehlich, J. E. (2019). Deep Learning for Automatically Detecting Sidewalk Accessibility Problems Using Streetscape Imagery. Proceedings of ASSETS 2019, 196–209. DOI: 10.1145/3308561.3353798.
- Prescott, M., Labbé, D., Miller, W. C., Borisoff, J., Feick, R., & Mortenson, W. B. (2020). Factors that affect the ability of people with disabilities to walk or wheel to destinations in their community: a scoping review. Transport Reviews, 40(5), 646–669. DOI: 10.1080/01441647.2020.1748139.
- Eisenberg, Y., Heider, A., Gould, R., & Jones, R. (2020). Are communities in the United States planning for pedestrians with disabilities? Findings from a systematic evaluation of local government barrier removal plans. Cities, 102, 102720. DOI: 10.1016/j.cities.2020.102720.