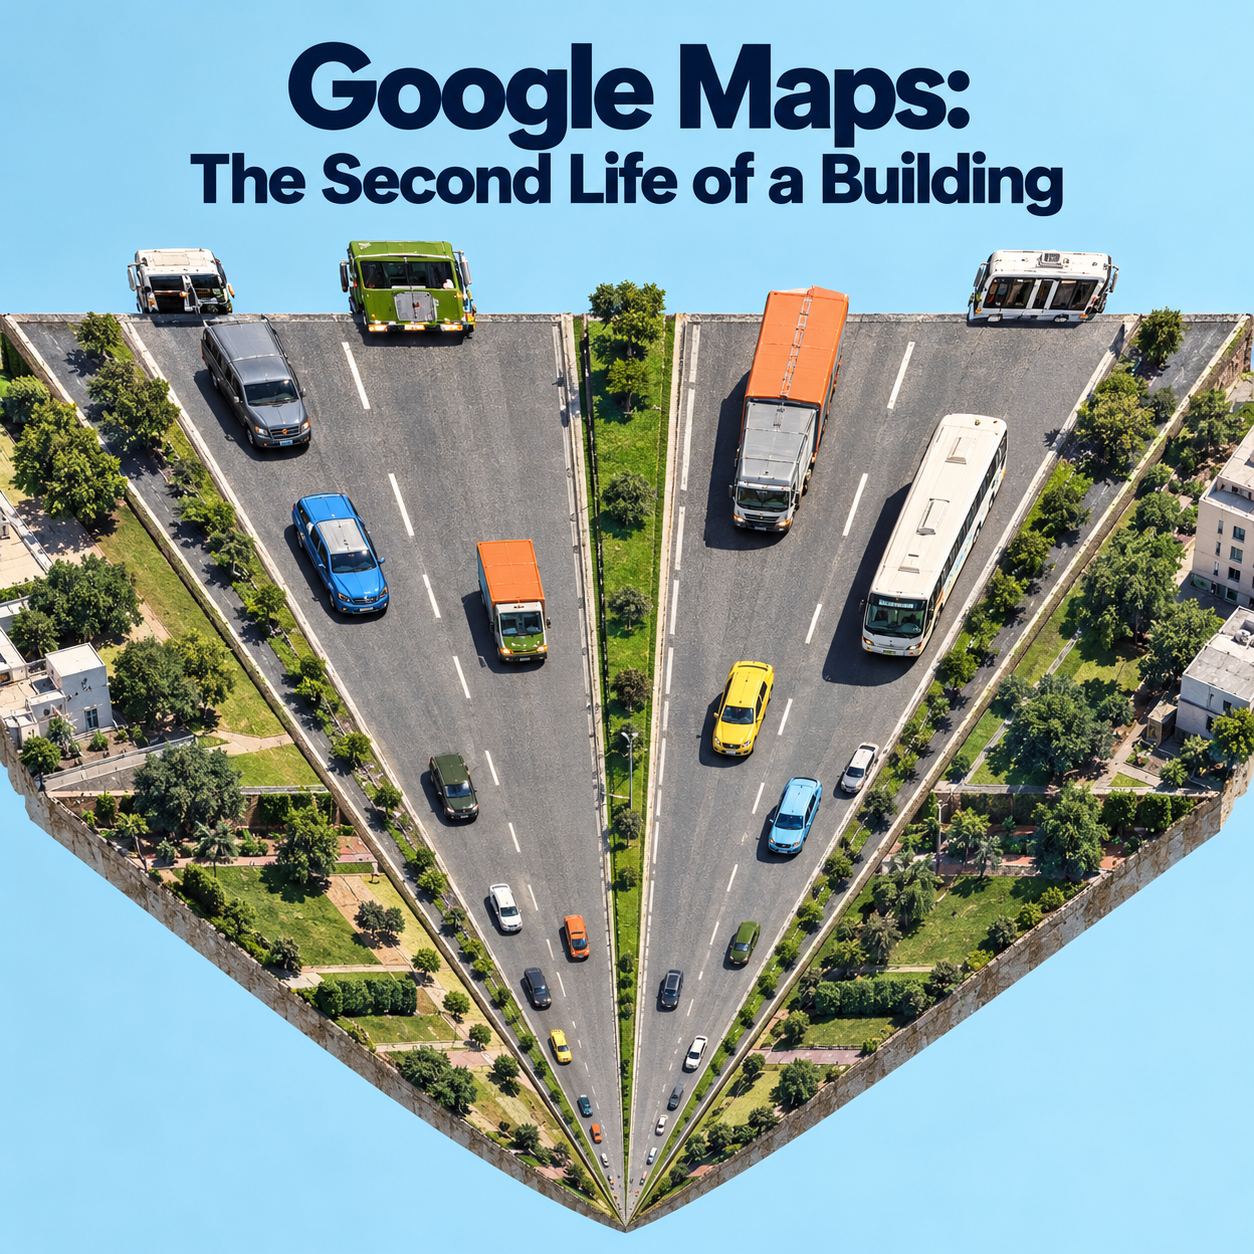
Google Maps: The Second Life of a Building

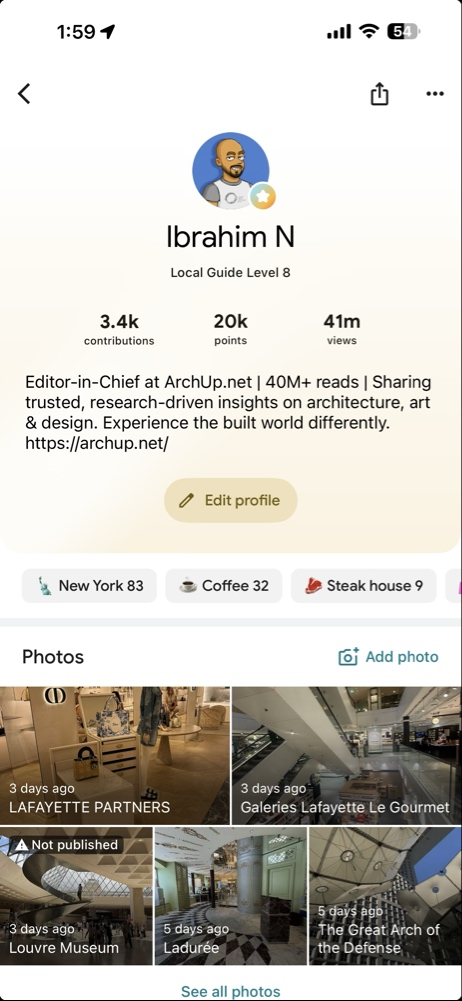
I have, as I write this, something past forty two million views and thirty eight million reads on the photographs and notes I have contributed to Google Maps over the years, and I mention the number not to boast but because it took me a long time to understand what it actually meant. For years I treated my contributions the way most people treat them, as a hobby, a reflex, a photograph snapped of a facade I admired or a correction made to a listing that was wrong. I am a critic of architecture by vocation, a person who audits buildings, who looks at them the way an accountant looks at a ledger, and the map was simply another place to put that looking. Then one day the scale of the number landed on me, and with it a realization that has not left me since. Those are not views of my photographs. They are views of buildings, through my eyes, by people who in the overwhelming majority of cases will form their first and sometimes only impression of a place from exactly that image. I had become, without deciding to, one of the many hands composing the public image of a city, and the map had quietly become the most widely consulted work of architectural criticism on earth, written by millions of amateurs and read by billions, most of whom do not know they are reading criticism at all.
That is the thing I want to examine, because it is larger than my own small corner of it. The decisive change in our relationship to the built world is not that maps became digital. It is that maps became platforms, that a single interface now fuses the abstract street diagram, the satellite image, the automated photographic record of every frontage, the user reviews, the ratings, the opening hours, and an algorithm that ranks all of it, and then serves the result to more than two billion people. Scholars describe this as the convergence of two different ways of knowing a place, the map’s diagram and the photograph’s trace, fused into a single spatialized image that has become the dominant way we navigate and explore. And the consequence for anyone who cares about buildings is profound, because the secondary experience of a place, the one made of images and ratings seen in advance, now precedes and frames the primary experience of actually standing there. We arrive at a real building already carrying its picture, so that arrival becomes recognition rather than discovery. The image comes first. The building has been demoted to a confirmation of its own photograph.
The Flattening of the Architectural Image
For most of the history of the discipline, the images that mediated a building were curated and slow. The architectural photograph, as a craft, was built around the three dimensional perspectival view, the camera moving out for context, around for form, in for detail, precisely because that movement conveys the plastic and spatial character of a work, the thing that makes architecture architecture rather than a picture of a wall. The flat, straight on elevational view was always treated as mere technical information, a drawing, not a portrait. What the map platform has done, through its automated street level capture, is to industrialize exactly that flat frontal view and make it the default image of the entire built world. A camera at roughly human eye height, in front of every facade in the coverage area, with no editorial selection, no waiting for the light, no choice of the revealing angle. The whole hierarchy of architectural imagery has been inverted. The view that the discipline considered the least expressive has become the one through which the public meets almost every building that exists.
This matters because it changes what a building is rewarded for. When the channel through which the public evaluates a work is the frontal, eye level, machine captured elevation, then the attributes that get seen, measured, and algorithmically scored are frontage attributes, the condition of the facade, the glazing of the storefront, the signage, the planting, the lighting. The entire apparatus of machine vision that now reads cities operates on exactly this visual channel, and so a quiet pressure builds inside design itself, tilting architecture toward the photographed elevation and away from everything the perspectival tradition existed to show, the section, the interior, the material joint, the spatial sequence, the slow unfolding of a plan that no eye level panorama will ever capture. The building has acquired a public face, in the most literal sense, and the rest of its body has slipped out of the public record. This is the first thing my forty two million views taught me, that I was not photographing buildings. I was photographing their faces, and the faces were becoming the buildings.
Who Controls the Image Now
There is a shift of authority buried in this that the profession has barely registered. The authored architectural photograph and the automated street level panorama make the same indexical claim, both present themselves as a true trace of the real, but they differ completely in who controls them. The magazine image was controlled by the architect and the editor, a curated act. The platform image is controlled by the capture schedule, the camera height, the stitching artifact, and the update interval of a company. The image of a building has passed out of the hands of the architect and the critic and into the hands of the platform and the crowd, and this is precisely the space into which my own contributions fell. When I photograph a building well, when I catch it in the right light and frame it so that it tells the truth about itself, I am wresting a small part of that control back, returning a fragment of authored seeing to a channel that is otherwise exhaustively, indifferently automatic. That, I have come to believe, is the real work hidden inside the hobby, and it is continuous with what I do on this platform, in the longer criticism I write for projects and places that deserve more than a thumbnail. The map and the essay are the same vocation practiced at two different scales, the one reaching billions with a single frame, the other reaching a serious few with a full argument.
Visibility Is Not Neutral, and It Is Not Evenly Given
The longer I contributed, the more I understood that visibility on the map is not a neutral by product of the technology. It is an asset, unevenly distributed, and its absence is a real form of erasure. The dictionaries of place names that underpin all geocoding are themselves wildly uneven, with the United States alone accounting for more than a quarter of the entries in one major gazetteer, more than all of Asia together, while India, with over seventeen percent of the world’s people, holds well under one percent. A place that is not in the gazetteer cannot be geocoded, and a place that cannot be geocoded drops out of every dataset built downstream, which produces a self reinforcing cycle of visibility and invisibility. The same holds at the finest grain of the city, where studies of German cities found that only a tiny fraction of street segments carried any sidewalk information at all, so that any service routing a person with limited mobility is silently biased toward the well mapped, usually wealthier, districts. The map does not show the city. It shows the part of the city that someone chose to record, and the unrecorded part suffers a second invisibility on top of whatever neglect made it unrecorded in the first place.
This is where I stopped seeing my contributions as decoration and started seeing them as a small act of documentation with consequences. Every building I add, every listing I correct, every facade I photograph honestly, pulls one more piece of the built world into the record, and the cities that are richly recorded are not an accident, they are the cumulative work of people who bothered. The critic who audits buildings and the guide who photographs them are doing, at different scales, the same thing a gazetteer does, deciding what exists in the digital image of the world. I did not understand, when I began, that contribution is a form of power, the power to confer presence, and that its uneven exercise is quietly redrawing which places are legible and which are not.
What the Map Does to the Body and the Business
The research on how this reshapes us is sobering, and it cuts two ways. On one side, turn by turn navigation reliably degrades our spatial learning. In a controlled walk through Kyoto, people using a smartphone map retraced their route less accurately and noticed fewer landmarks than those using paper, and, most tellingly, did not perceive that they had been impaired, their confidence undimmed by their actual loss. A longer study of habitual drivers found a dose dependent relationship, more lifetime use of satellite navigation predicting weaker use of the hippocampus dependent spatial memory that builds a true cognitive map, the mind quietly trading survey knowledge for stimulus and response. On the other side, the same navigation measurably lowers the anxiety and cognitive cost of moving through an unfamiliar place, which is no small gift. But the architectural consequence is the one that haunts me, because a person who follows the optimized blue line through a city attends less to everything between the origin and the destination, the frontages and thresholds and textures and signs, the exact material that we design. We are composing interstitial experiences for people who, increasingly, are instructed not to look at them.
And then there is the hardest evidence, that the map platform has become commercial infrastructure in the most consequential sense, that a business can be predicted to live or die from its listing alone. A study of nearly forty one thousand Polish restaurants found that a model using only the features of a Google Maps profile could predict, with considerable accuracy, which would close within nine months, and that the single strongest predictor was not aggregate fame but the number of ratings in the thirty days before the survey, the recency of attention. Presence, reviews, and recent reviews are three different thresholds of visibility, and only the last reliably predicts survival. This is the brutal underside of the beautiful map. The construction of a place, its physical quality, its architecture, can be quietly overruled by its digital attention, and a well made building that falls out of the recent record can starve while a photogenic one thrives. The listing is not a marketing afterthought. It behaves like a vital sign.
Visibility Capitalized, and Concentrated
The visibility even capitalizes into the ground itself. The cleanest causal evidence comes from short term rentals, where quasi experimental work around municipal restrictions showed that where a property can be seen and booked by global demand its price reflects that visibility, rising sharply near the most photographed landmarks and falling where the platform’s reach was cut. Street level imagery, meanwhile, has become a measurement instrument precise enough that a neural network trained on paired images could detect property upgrading across tens of thousands of buildings and map the spatial clustering of gentrification, though its accuracy depends heavily on the morphology of the city, reading dense fabric well and sprawling or incremental change poorly. The platform does not merely represent the value of places. It participates in creating it, steering demand toward what is already visible, concentrating footfall on the handful of buildings that photograph best, so that in a city like Barcelona the architecture itself, and one architect in particular, becomes the dominant semantic cluster of millions of reviews, pulling the crowds ever more tightly onto the same few icons until the residents declare the limit long since passed. Visibility redistributes the world toward whatever is already visible, which is the opposite of what a fair map would do.
Why I Keep Contributing Anyway
Knowing all of this, a reasonable person might stop, might conclude that feeding the platform only deepens its biases. I have reached the opposite conclusion, and it is the thesis I have been circling. The platform’s image of the built world is going to exist whether or not people who understand architecture participate in making it, and the only question is whether that image is composed by indifferent automation and careless crowds alone, or whether some fraction of it is composed by people who actually know how to see a building. My forty two million views are not a vanity metric. They are forty two million small corrections to the flattening, forty two million instances in which a building was met, by a stranger, through the eyes of someone who had been trained to look at it honestly. The serious architectural research of the coming years will have to treat the map not as a utility but as the single largest repository of public architectural perception ever assembled, biased, uneven, automated, and decisive, and the people equipped to improve it are precisely the critics and architects who have mostly disdained it as beneath them.
This is why the map and the platform where I write longer criticism are not two separate activities for me but one continuous responsibility. The news will keep covering the grand openings, and the design competitions will keep rewarding the building as it appears in the architect’s own chosen photograph, and meanwhile the actual public image of that building, the one that will shape whether anyone visits it, values it, or even believes it exists, is being assembled frame by frame on a map that most of the profession has never thought of as its concern. The sustainability of a building’s reputation now depends on its second, algorithmic life as much as on its physical one, and that second life is authored, or abandoned, by whoever shows up to compose it. So I will keep photographing facades in the right light, keep correcting the listings, keep adding the places no one recorded, because what I finally understood behind that number is simple and, I think, true. A building is no longer finished when it is built. It is finished, and refinished endlessly, in the image the world keeps of it, and if those of us who can actually see architecture refuse to take part in making that image, we will have surrendered the most widely read criticism in history to a camera that captures everything and understands nothing. I would rather win that round, one honest frame at a time.
✦ ArchUp Editorial Insight
The essay is a first-person reflection built around the author’s own contribution metrics, and that personal frame is worth naming — but it converts the anecdote into a structural argument with unusual rigor, and its governing insight is that the map ceased to be a utility and became the largest repository of public architectural perception ever assembled, read by billions who do not know they are reading criticism at all. The most analytically consequential observation is the inversion of the architectural image hierarchy: the automated street-level capture industrialized the flat frontal elevation that the discipline always treated as mere technical information, the least expressive view, and made it the default image of the entire built world, which generates a quiet pressure inside design itself toward frontage attributes — facade, glazing, signage, lighting — and away from the section, the interior, the material joint, the spatial sequence that no eye-level panorama will capture. This is the same decoupling of the photographed surface from the inhabited building that this archive traced in Brain Rot in the Rabbit Hole, where algorithmic selection rewarded the thumbnail over the building, now operating not on a curated platform but on the infrastructure through which two billion people first meet almost every structure that exists. The essay’s hardest evidence turns visibility into a vital sign — a restaurant’s survival predictable from its listing alone, with recent attention the strongest signal — which names the liability mechanism precisely: the physical quality of a place can be overruled by its digital attention, and visibility capitalizes into the ground itself, concentrating footfall and value on whatever already photographs well, the overtourism condition this archive examined in Cuckoo City Urbanism. Where the piece is weakest is its resolution, which relocates a structural problem onto individual virtue — the critic contributing one honest frame at a time against indifferent automation — a move this archive has repeatedly identified, as in Architectural Attention Economy, as the mechanism by which systemic bias is quietly transferred to the personal labor of the least powerful party; the uneven gazetteer, the self-reinforcing cycle of visibility and erasure, and the concentration of value toward the already-visible are not conditions that millions of honest frames can correct, because they are produced by the platform’s governance and capture economics, not by the carelessness of the crowd the author hopes to outwork.
Ibrahim Fawakherji — ArchUp
Sources
- Kurt A, et al. Driving Tourist Behaviour: Evidence from Google Maps Usage among Tourists. Quality and Quantity, 2025.
- Gilge C. Google Street View and the Image as Experience. GeoHumanities, 2016.
- Campbell H. The Facade Fills the Frame: The Uses and Meanings of the Elevational View. The Journal of Architecture, 2016.
- Graham M, De Sabbata S. Mapping Information Wealth and Poverty: The Geography of Gazetteers. Environment and Planning A, 2015.
- Mobasheri A, et al. Are Crowdsourced Datasets Suitable for Specialized Routing Services? OpenStreetMap for Routing of People with Limited Mobility. Sustainability, 2017.
- Starakiewicz T, Wójcik P. Predicting Restaurant Survival Using Nationwide Google Maps Data. Knowledge Based Systems, 2025.
- Sugimoto M, et al. Online Mobile Map Effect: How Smartphone Map Use Impairs Spatial Memory. Spatial Cognition and Computation, 2021.
- Dahmani L, Bohbot VD. Habitual Use of GPS Negatively Impacts Spatial Memory during Self Guided Navigation. Scientific Reports, 2020.
- Aversa J, et al. Big Data Analytics: The New Boundaries of Retail Location Decision Making. Papers in Applied Geography, 2018.
- Koster HRA, et al. Short Term Rentals and the Housing Market: Quasi Experimental Evidence from Airbnb in Los Angeles. Journal of Urban Economics, 2021.
- Ilic L, et al. Deep Mapping Gentrification in a Large Canadian City Using Deep Learning and Google Street View. PLOS ONE, 2019.
- Ravuri ED, Hollstein L. An Investigation of the Use of Google Street View for Identifying Gentrification across Diverse United States Morphological City Types. Urban Geography, 2025.
- Alonso Almeida M, et al. Are Social Media Data Pushing Overtourism? The Case of Barcelona and Chinese Tourists. Sustainability, 2019.
- Gösta A, et al. Data Informed Urban Design: An Overview of the Use of Data and Digital Tools in Urban Planning and Design. Built Environment, 2020.
- Gupta M, et al. Towards More Universal Wayfinding Technologies: Navigation Preferences Across Disabilities. CHI Conference on Human Factors in Computing Systems, 2020.