Who Sets the City’s Clock? Urban Rhythms, Attention and Social Coordination

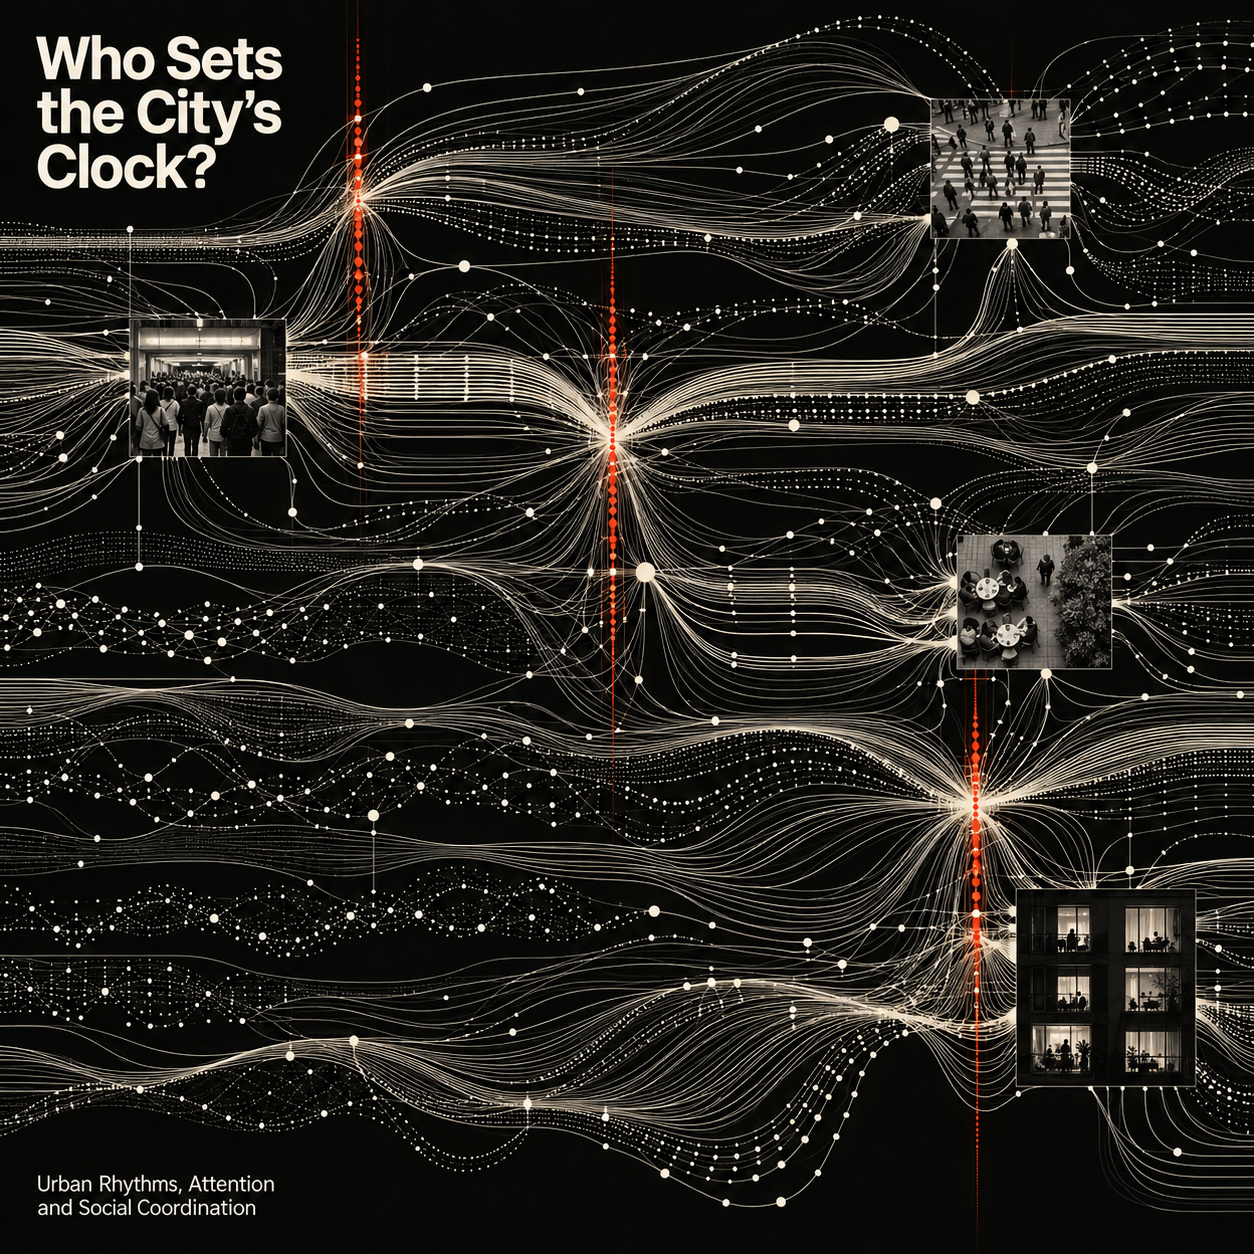
The same street can seem empty in the morning and overloaded a few hours later without any change to its buildings. A match, a shift ending or a service opening alters who needs to be there at the same time. Architecture is usually documented as an arrangement of spaces; its availability is also an arrangement of hours.
This review asks who produces those hours and how they distribute access, waiting and attention. “Social engineering” is used here in the limited sense of organising conditions that may shape collective behaviour, not as a claim of covert control. A recurring pattern is evidence of timing; it is not, by itself, evidence that somebody deliberately designed the pattern.
The method is a critical comparison of time geography, empirical communication research, a transport operating report and research on digital exposure. The proposed measurements and scenarios are an editorial planning framework, not a validated universal index. City movement, platform activity and political persuasion remain different outcomes.
Three mechanisms that should not be collapsed
First, a rhythm can emerge from many individual decisions under similar conditions. Second, an institution can coordinate activity by setting a school, work or event schedule. Third, an actor can deliberately choose when to communicate in order to increase attention or influence. These mechanisms may overlap, but they require different evidence.
An empty street during a televised match does not establish that its emptiness was planned. A transport agency publishing travel advice demonstrates an intervention in timing, though it does not automatically prove the advice caused every change in arrivals. Alleging that an official announcement was scheduled to avoid scrutiny requires records or other evidence of intent, not just a coincidence with a sporting event.
A short distance can still be inaccessible
Hägerstrand’s 1970 work placed people and their constraints within regional analysis, providing a foundation for time geography. Its relevance is that a journey is limited by more than distance: people must fit activities into finite schedules and meet requirements imposed elsewhere. A nearby facility may be practically unavailable when its hours do not overlap with the time a person can use it.
Lefebvre’s Rhythmanalysis offers a complementary interpretive lens on repeated activity, bodies, space and everyday time. It is a theoretical resource, not a dataset proving that any one timetable causes a particular behaviour. Together, these approaches suggest looking at the city as overlapping durations rather than as a single peak-hour map.
Consider a hypothetical parent whose shift ends shortly before a nursery closes. Moving a service ten minutes closer may help, but changing its opening hours could matter more. For a night-shift worker, a daytime-only facility can remain inaccessible despite being within walking distance. These examples illustrate a planning question; they are not findings about a named city.
Biological and seasonal rhythms complicate the timetable
Monsivais and colleagues’ 2017 study analysed calling patterns from about one million users and found associations between the beginning and end of calling activity, solar timing and seasons across cities within one time zone. Calls were an indirect indicator of activity, not direct observation of sleep or pedestrian movement. The finding cautions against assuming that a shared clock produces identical daily rhythms.
Accordingly, a “quiet Sunday morning” must be located within a specific workweek, season and neighbourhood. Sunday can be a workday or a rest day depending on context. Heat, school terms, religious schedules and shift patterns are variables to investigate, rather than convenient background explanations to attach after seeing a graph.
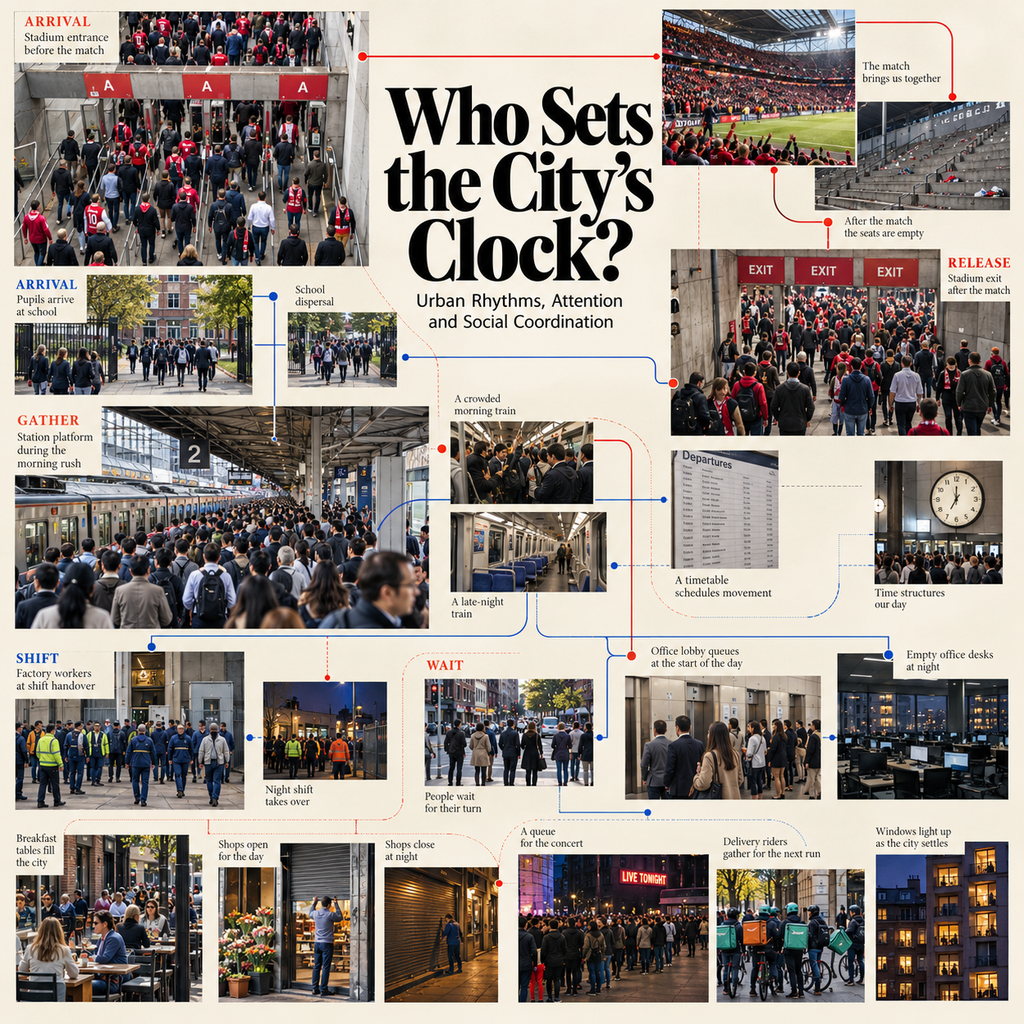
The diagram makes a planning question visible: when school dismissal, a shift change and an event ending overlap, their schedules may place simultaneous demands on entrances, pavements and transport. Adjusting a timetable can therefore be considered alongside changing spatial capacity. These are illustrative relationships to test against local counts and operating records; the montage does not demonstrate that a single actor controls the city’s rhythms.
The match concentrates people before it concentrates traffic
A football fixture gives many people a common deadline. Arrival can spread across hours, while departure can be concentrated after the final whistle. The planning task is to examine the distribution, not divide stadium capacity by a whole day and call the average manageable.
Transport for London’s operating report for the first quarter of 2024/25 describes coordinated travel advice around the Champions League final. It reports that the largest number of exits at Wembley Park occurred between 16:00 and 18:00, before a 20:00 kick-off. This documents an operating practice and an observed arrival pattern; it is not a controlled estimate of the advice’s causal effect.
Consider an illustrative scenario, not a measured event: 12,000 people arriving in 30 minutes produce an average arrival rate of 400 per minute. The same number across 90 minutes averages about 133 per minute. This calculation does not establish safe crowd capacity: usable width, bottlenecks, direction, transport service and individual needs still matter. It shows why timing is a design variable even when total attendance is unchanged.
Any attempt to spread arrivals must also ask who can arrive early. A person with inflexible work or care responsibilities may have little choice. Moving the peak can redistribute inconvenience rather than remove it. Staff finishing after the public has departed need transport and lighting too.
Announcements and the competition for attention
A government statement, commercial advertisement and transport alert may share a delivery channel but have different purposes. Analysis should separate message release, actual exposure, comprehension and subsequent action. More views at a particular hour do not necessarily mean greater understanding or persuasion.
For a public notice, effectiveness might mean that affected people receive it before they need to act, including those who are offline or working. For an advertisement, the selected outcome might be a purchase. For an emergency message, reach and clarity matter in a different way. Treating all three as a search for a single “best posting time” hides their different obligations.
An investigation of strategic timing should compare similar announcements, identify competing events and document the decision process where possible. Otherwise it may simply rediscover that institutions publish during working hours. The absence of immediate response can also reflect language, accessibility or lack of a practical way to act.
The digital feed is not a public square on a clock
Bakshy, Messing and Adamic’s 2015 Facebook study examined ideologically diverse news exposure and the roles of social networks, ranking and individual selection. It did not establish an optimal posting hour or describe current platform rules. Its useful lesson for this comparison is that publication, potential visibility and chosen engagement are distinct stages.
A post released at noon may be seen later; a physical gate opened at noon changes access at that moment. Both can organise opportunity, but their mechanisms differ. A platform can reorder visibility, whereas a transport service must move bodies through finite space. Comparing them is productive only if those differences remain explicit.
| System | Who sets a timing condition? | Outcome to measure | Common inference error |
|---|---|---|---|
| Work and school | Employers and institutions | Accessible service hours and travel overlap | Assuming everyone can shift their journey |
| Football event | Organiser and transport operators | Arrival distribution, queues and missed services | Using attendance as a measure of peak load |
| Public announcement | Issuing institution and intermediaries | Timely receipt, understanding and ability to act | Equating views with influence or inferring intent from timing |
| Digital feed | Publisher, platform and user | Exposure and a predefined response | Treating posting time as viewing time |
| Public facility | Owner and operator | Overlap between opening hours and actual availability | Counting proximity as sufficient access |
What a temporal audit could measure
Begin with a specified population and activity. Map the hours when the service is open, the hours when people can reach it, and the travel time needed between fixed obligations. Report results by relevant groups where data permit, rather than hiding differences in a citywide average.
Three simple proposed measures make the question more concrete: the share of available time that overlaps with opening hours; the share of daily arrivals occurring in the busiest chosen interval; and waiting minutes per completed visit. These measure access and concentration, not social well-being by themselves. Record cancelled trips and people who could not attend, because a quiet facility may conceal excluded demand.
Evaluate a schedule change using comparable days, accounting for weather, school terms and other events. Where feasible, use a comparison location or a staged implementation. Define the expected result before analysis. If an earlier opening coincides with extra staff and a new transport route, its independent contribution remains uncertain.
Use aggregated counts and consent-based diaries where appropriate. Persistent tracking of named individuals is not required for every planning question. Data from a phone provider or platform also omit some people and activities; large samples do not automatically remove selection bias.
Designing for different clocks
The architectural response could include independently accessible parts of a building, waiting areas that remain available beyond office hours, and maintenance routes that allow one zone to close while another operates. These are propositions to test against staffing, security, energy and local requirements. Extending all hours without examining labour consequences is not automatically a fairer solution.
The central question is who gains flexibility and who supplies it. A customer may gain an evening appointment because a worker loses predictable time. A city’s temporal plan should make that exchange visible. It should also distinguish a necessary common deadline from synchronisation that can be relaxed.
✦ ArchUp Editorial Insight
Institutions often choose schedules within their own boundaries while the costs of coordination appear elsewhere. An employer sets a shift, a venue sets a kick-off and a service provider sets closing time; the traveller must reconcile the resulting sequence. When many organisations choose similar deadlines, the city may respond with additional infrastructure even though part of the pressure originates in the timetable. This does not mean that changing hours can replace every capacity investment. It means that a project brief should test whether the peak is unavoidable before treating it as a purely spatial requirement. A temporal impact assessment could identify who controls each deadline, which users cannot adjust, and where waiting or missed access accumulates. Its recommendations would need negotiation with workers and service operators, rather than an abstract call for flexibility. The resulting architecture might provide separable operating zones and protected waiting, but those features become useful only when an institution accepts responsibility for their hours. The city’s clock is therefore also a distribution of decision-making power and the costs of adaptation.
References
- Hägerstrand, T. What about people in regional science? Papers of the Regional Science Association, 24, 1970.
- Lefebvre, H. Rhythmanalysis: Space, Time and Everyday Life. Bloomsbury Revelations edition, 2013.
- Monsivais, D., Ghosh, A., Bhattacharya, K., Dunbar, R. I. M. and Kaski, K. Tracking urban human activity from mobile phone calling patterns. PLOS Computational Biology, 13(11), e1005824, 2017.
- Transport for London. Customer service and operational performance report, Quarter 1 2024/25, second edition; reporting period 1 April–22 June 2024.
- Bakshy, E., Messing, S. and Adamic, L. A. Exposure to ideologically diverse news and opinion on Facebook. Science, 348(6239), 2015, 1130–1132.